


Published
July 6, 2023
Contact
Yassert A. Gonzalez | Manager – Economics, Demographics & Research | 813-582-7356 | [email protected]
Last updated
July 25, 2023
Every five years, staff updates the Long-Range Growth Forecast. One of the first tasks is to review the latest projections published by the University of Florida’s Bureau of Economic and Business Research (BEBR)[i]. We also look at trends in published projections across the years. As we shall see, BEBR is still expecting significantly higher 2045 populations for all eight Tampa Bay Region Counties. Nonetheless, for Hernando and Hillsborough Counties, the 2045 population growth is projected to be slightly lower than previous projections.
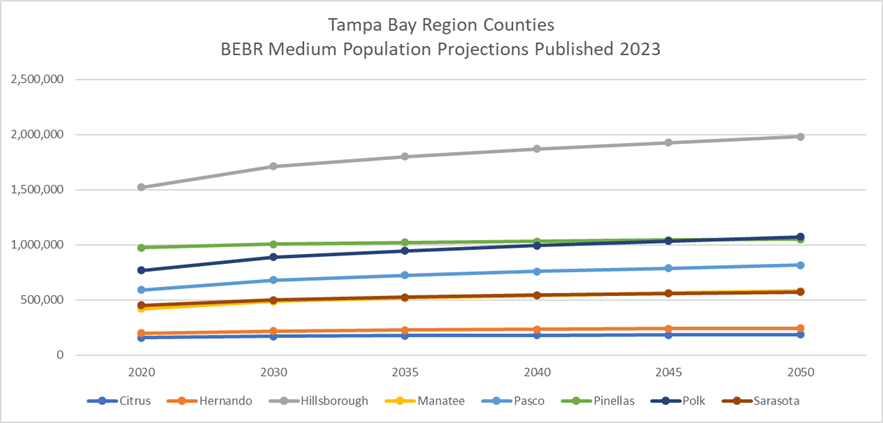
BEBR produces the official city, county, and state population estimates and countywide forecasts yearly. More specifically, BEBR produces three forecasts: Low, Medium, and High. The medium forecast has the highest level of certainty. For the purposes of this article, the Tampa Bay Region comprises eight counties: Citrus, Hernando, Hillsborough, Manatee, Pasco, Pinellas, Polk, and Sarasota. As seen in Table 1 and Chart 1, these eight counties are expected to grow rapidly through 2050. In particular, Hillsborough County is expected to continue to have the largest population through 2050 and attract one of every three new Tampa Bay Region residents. Moreover, Polk County is expected to exceed 1 million total residents by 2050.
Table 1. BEBR Medium Population Projections Published in 2023 for Eight Tampa Bay Region Counties
| Counties | 2020 | 2030 | 2035 | 2040 | 2045 | 2050 | 2020-2050 New Residents | 2020-2050 Percent Change |
| Citrus | 158,009 | 170,700 | 176,300 | 180,800 | 184,400 | 187,800 | 29,791 | 18.85% |
| Hernando | 199,207 | 217,500 | 226,400 | 233,500 | 239,300 | 244,500 | 45,293 | 22.74% |
| Hillsborough | 1,520,529 | 1,710,600 | 1,799,300 | 1,868,700 | 1,927,300 | 1,981,900 | 461,371 | 30.34% |
| Manatee | 421,768 | 486,300 | 517,300 | 541,600 | 562,300 | 581,800 | 160,032 | 37.94% |
| Pasco | 592,669 | 680,600 | 723,900 | 759,000 | 788,400 | 815,800 | 223,131 | 37.65% |
| Pinellas | 972,852 | 1,005,400 | 1,020,500 | 1,032,300 | 1,042,300 | 1,051,600 | 78,748 | 8.09% |
| Polk | 770,019 | 888,400 | 946,100 | 993,900 | 1,033,800 | 1,070,900 | 300,881 | 39.07% |
| Sarasota | 452,378 | 501,200 | 524,400 | 543,100 | 559,000 | 573,600 | 121,222 | 26.80% |
| Tampa Bay Region | 5,087,431 | 5,660,700 | 5,934,200 | 6,152,900 | 6,336,800 | 6,507,900 | 1,420,469 | 27.92% |
Chart 1. BEBR Medium Population Projections Published in 2023 for Eight Tampa Bay Region Counties
After looking at the latest published projections, we reviewed trends in 2045 projections published since 2017[ii]. We wanted to see how the 2045 projections have changed over time. As seen in Table 1, for the Tampa Bay Region, the last medium 2045 projection (published in 2023) is 3.3% higher (204,100 more new persons) than the first 2045 medium projection (published in 2017) and trending up slightly.
Table 1. BEBR 2045 Medium Population Projections by County by Publication Year
| County | 2017 | 2018 | 2019 | 2020 | 2021 | 2022 | 2023 | 2017-2023 Percent Change | 2017-2020 Percent Change | 2020-2023 Percent Change |
| Citrus | 170,000 | 168,000 | 173,700 | 177,300 | 174,300 | 183,500 | 184,400 | 8.47% | 4.29% | 4.00% |
| Hernando | 244,400 | 240,400 | 246,900 | 244,400 | 241,500 | 242,300 | 239,300 | -2.09% | 0.00% | -2.09% |
| Hillsborough | 2,007,100 | 1,983,200 | 1,950,500 | 1,959,200 | 1,958,300 | 1,919,800 | 1,927,300 | -3.98% | -2.39% | -1.63% |
| Manatee | 535,200 | 550,800 | 545,700 | 542,200 | 544,400 | 558,500 | 562,300 | 5.06% | 1.31% | 3.71% |
| Pasco | 715,800 | 719,000 | 708,900 | 711,000 | 720,500 | 776,300 | 788,400 | 10.14% | -0.67% | 10.89% |
| Pinellas | 1,021,300 | 1,061,600 | 1,075,000 | 1,080,600 | 1,063,800 | 1,025,200 | 1,042,300 | 2.06% | 5.81% | -3.54% |
| Polk | 935,200 | 943,600 | 916,200 | 924,700 | 965,800 | 1,019,500 | 1,033,800 | 10.54% | -1.12% | 11.80% |
| Sarasota | 503,700 | 522,600 | 540,200 | 546,500 | 557,500 | 547,900 | 559,000 | 10.98% | 8.50% | 2.29% |
| Tampa Bay Region | 6,132,700 | 6,189,200 | 6,157,100 | 6,185,900 | 6,226,100 | 6,273,000 | 6,336,800 | 3.33% | 0.87% | 2.44% |
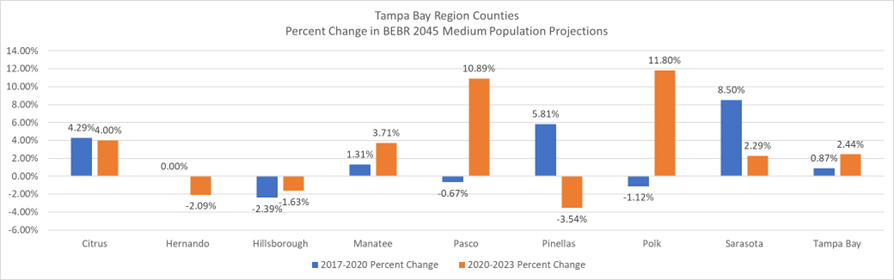
When we look at individual counties, six of these eight counties show higher 2045 projections published every year. Gains in expected new residents ranged from 2.06% (21,000 more new persons in Pinellas) to 10.98% (55,300 more new persons in Sarasota County). Hernando and Hillsborough Counties are the only two counties where the last 2045 projection is lower than previous projections. More specifically, Hernando’s latest 2045 forecast is -2.09% lower (5,100 less new persons) and Hillsborough’s latest 2045 forecast is -3.98% (79,800 less new persons). In Pinellas and Polk Counties, trends shifted from 2020. Pinellas County saw its 2045 medium projection seesawed from an increase of 5.81% (59,300 more persons from 2017 to 2020) and to a decrease of 3.54% (38,300 less new person from 2020-2023). Polk County’s 2045 medium population projection declined -1.12% (10,500 less new persons) from 2017 to 2020 and increased 11.80% (109,100 more new persons) from 2020 to 2023. See Chart 2-4 below.
Chart 2. BEBR 2045 Medium Projections Published in 2017, 2020, and 2023 for Citrus, Hernando, Manatee and Sarasota Counties
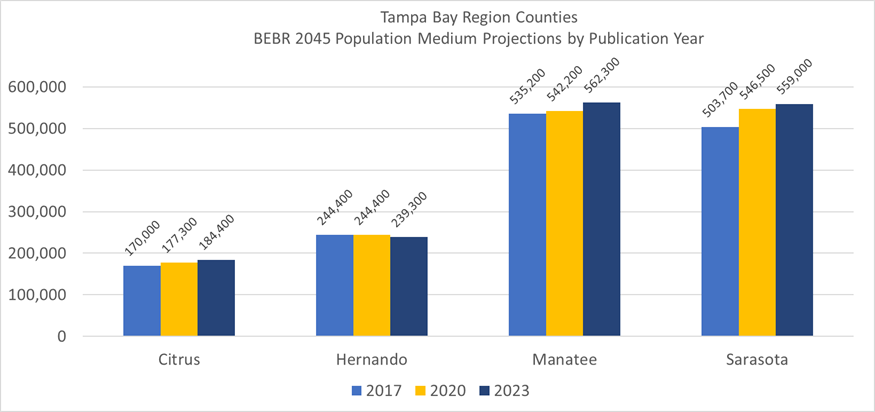
Chart 3. BEBR 2045 Medium Projections Published in 2017, 2020, and 2023 for Hillsborough, Pasco, Pinellas, and Polk Counties
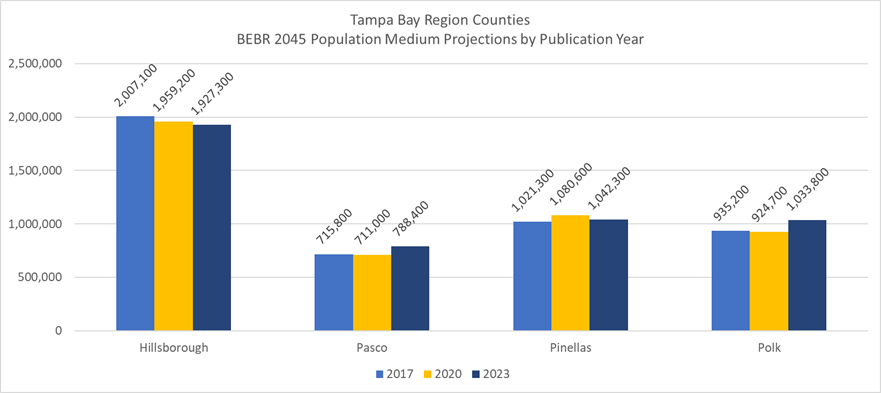
Chart 4. Percent Change in 2045 Population Projection for Tampa Bay Region Counties
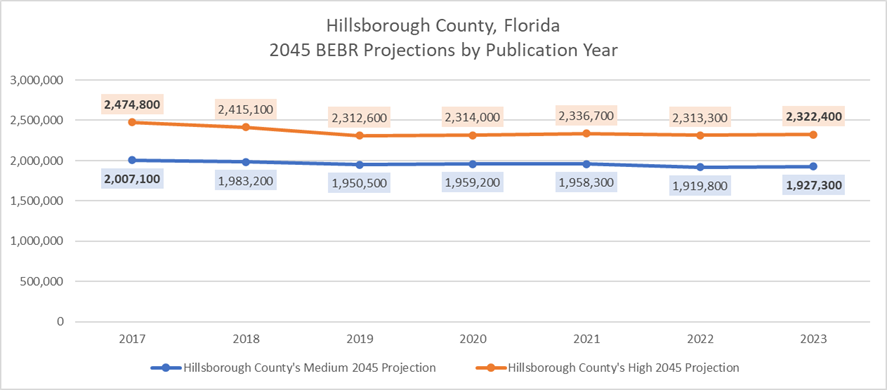
For Hillsborough County, we also looked at both medium and high population 2045 projections published since 2017. As seen in Chart 5, both the medium and high 2045 population growth projections have been trending lower since 2017. The latest population projection is 6.16% (152,400 less new persons than previously projected) lower. When reached, BEBR staff stated that “the growth rate of the state projections slows down in the long term due to the aging of Florida’s population and the associated drag on population growth caused by negative natural increase[iii].”
Chart 5. BEBR Medium and High 2045 Projections by Publication Year for Hillsborough County
As we have seen, BEBR is expecting rapid growth in the Tampa Bay Region Counties through 2045. For all these counties the 2045 population is expected to be significantly higher than their current population estimate. For Hernando and Hillsborough Counties, their latest 2045 population projection is expected to be significantly higher than their 2020 population estimate but slightly lower than their first 2045 population projection published back in 2017.
[i] 1) Projections of Florida Population by County, 2020–2045, with Estimates for 2016. Bureau of Economic and Business Research. Florida Population Studies. Volume 50, Bulletin 177, April 2017. Link: https://bebr.ufl.edu/population/population-data-archive/
2) Projections of Florida Population by County, 2020–2045, with Estimates for 2017. Bureau of Economic and Business Research. Florida Population Studies. Volume 51, Bulletin 180, January 2018. Link: https://bebr.ufl.edu/population/population-data-archive/
3) Projections of Florida Population by County, 2020–2045, with Estimates for 2018. Bureau of Economic and Business Research. Florida Population Studies. Volume 52, Bulletin 183, April 2019. Link: https://bebr.ufl.edu/population/population-data-archive/
4) Projections of Florida Population by County, 2020–2045, with Estimates for 2019. Bureau of Economic and Business Research. Florida Population Studies. Volume 53, Bulletin 186, January 2020. Link: https://bebr.ufl.edu/population/population-data-archive/
5) Projections of Florida Population by County, 2020–2045, with Estimates for 2020. Bureau of Economic and Business Research. Florida Population Studies. Volume 54, Bulletin 189, April 2021. Link: https://bebr.ufl.edu/population/population-data-archive/
6) Projections of Florida Population by County, 2020–2050, with Estimates for 2021. Bureau of Economic and Business Research. Florida Population Studies. Volume 55, Bulletin 192, February 2022. Link: https://bebr.ufl.edu/population/population-data-archive/
7) Projections of Florida Population by County, 2020–2050, with Estimates for 2022. Bureau of Economic and Business Research. Florida Population Studies. Volume 56, Bulletin 195, April 2023. Link: https://bebr.ufl.edu/population/population-data-archive/
[ii] Projections of Florida Population by County, 2020–2045, with Estimates for 2016. Bureau of Economic and Business Research. Florida Population Studies. Volume 50, Bulletin 177, April 2017. https://bebr.ufl.edu/population/population-data-archive/
[iii] Rayer, Dr. Stefan. Email to Yassert Gonzalez. “RE: What’s causing downtrend in Hillsborough County 2045 Forecasts since 2017?”. 21 February 2022.